
Measuring systems
The following prodives an overview on the measuring devices used during the Swabian MOSES measurement campaign in the Swabian Alb, Neckar Valley and Filder area.
Some specialized and highly complex measuring devices are set up at the main locations (measuring stations) of the campaign. These include a precipitation radar and special aerosol measuring devices. With the deployment of further measuring instruments, which are available in larger numbers, entire sensor networks can be set up. For example, a total of 23 distrometers are used for local precipitation measurement. In addition, mobile measuring systems enable flexible investigations, such as a rover equipped with neutron sensors for continuous measurement of soil moisture. Two research aircraft provide important data on the prevailing flow conditions on days with particularly high thunderstorm activity.
Information on the scientific background of the measurements and the research objectives can be found here.
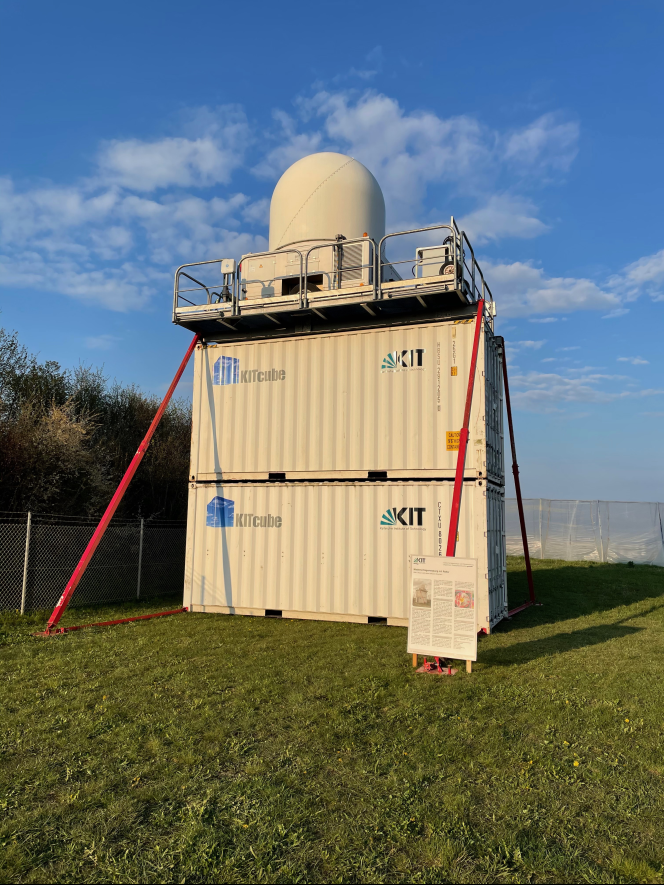
KITcube observatory
KITcube - Integrated atmospheric observation system
|
The following provides a brief overview of the KITcube, how the various KITcube measurement devices work and how they can be used. In-depth scientific details, technical specifications and a review of the deployment of the KITcube in previous campaigns can be found on the KITcube homepage. |
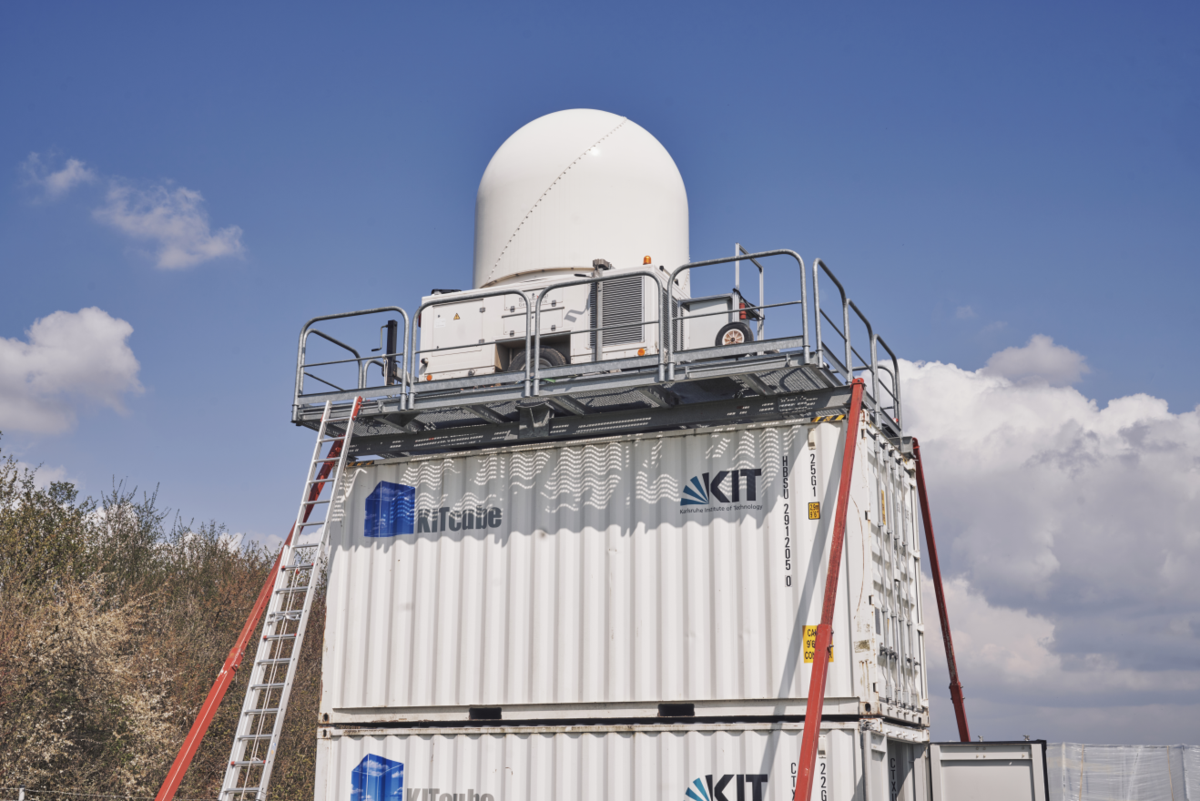
KITcube is the highly sophisticated, integrated atmospheric observation system of the Institute for Meteorology and Climate Research, Troposphere Research Division (IMK-TRO). KITcube consists of a mobile system for worldwide deployment and a stationary observatory for continuous monitoring.
The mobile KITcube combines high-resolution measurements of scanning remote sensing systems (e.g. wind lidar, X-band precipitation radar, humidity and temperature profilers, sun photometers, water vapour and cloud camera systems, and many more) with classical in situ instruments on measurement masts and on weather balloons (local measurements). Fully coordinated scans of the systems make the KITcube a very well suited observation system for studies of thunderstorms, atmospheric convection, clouds and precipitation. The mobile KITcube main site during the Swabian MOSES measurement campaign is located in Rottenburg am Neckar, the X-band precipitation radar is installed in Nürtingen.
The stationary KITcube at KIT Campus North in Eggenstein-Leopoldshafen north of Karlsruhe consists, among other things, of the 200 meters high meteorology mast, which has been measuring air temperature, humidity, wind and turbulence in continuous operation since 1972, and a modern C-band precipitation radar. The stationary KITcube is part of the AERONET measurement network, providing data for the station "Karlsruhe". The mobile KITcube can be used as additional temporary station during measurement campaigns such as Swabian MOSES ("KITcube_Rottenburg"). Thus, both contribute to a worldwide database of aerosol and radiation measurements.
Precipitation measurement (Distrometer)
With a distrometer the size spectrum of hydrometeors (raindrops, hail, sleet, snowflakes etc.) can be determined. Hydrometeors such as raindrops can have a large variety of diameters, from fine drizzle to the summery downpour with very large raindrops. A distrometer can be used to determine the diameter of the raindrops that fall through the sensor within a specific time. An assumption about the drop size distribution, the so-called drop spectrum, is necessary for the conversion of radar reflectivity measured by precipitation to the precipitation intensity (millimetres per hour = litres per square metre and hour), as it is tyically given in rain radar products from weather services.
During the Swabian MOSES measurement campaign, so-called Parsivel Distrometers (Particle Size and Velocity) are used, which can measure droplet size and velocity separately by means of a laser. An entire network of 23 Parsivel distrometers has been installed, which provides information on the droplet spectrum and the amount of precipitation in the Neckar Valley and the Swabian Alb.
Energy balance station
At an energy balance station there are first of all measuring devices which measure the air pressure (barometer), the air temperature (thermometer) and the air humidity (hygrometer) on site. An ombrometer ("precipitation pot") is used to determine the amount of precipitation that has fallen.
In addition, an energy balance station features special sensors that can measure energy and mass fluxes. These are essential for understanding the evolution of heat and moisture and thus the effects of heat waves and droughts (see research objectives).
- Ultrasonic anemometers: In addition to the three-dimensional wind direction and velocity, ultrasonic measurements allow the local determination of momentum flux and sensible heat flux at 4 meters above ground.
- Pyranometer: Measurement of the short-wave solar irradiation (global radiation) as well as the solar radiation reflected at the earth's surface (reflex radiation) at a height of 3 meters, so that the albedo of the earth's surface can be determined.
- Pyrgeometer: Same as the pyranometer, but for long-wave terrestrial radiation.
- Ground heat flux plates: Measurement of the heat transport from the ground into the atmosphere and vice versa at a depth of 5 centimetres.
- Radiation thermometer: Determination of surface temperature.
- Inclinometer: Electrical measurement of the instrument's inclination.
- SISOMOP: Soil temperature and soil moisture at three depths.
- Moisture and carbon dioxide sensor: Measurement of CO2 and water vapour concentrations and the corresponding CO2 and latent heat fluxes.
Radiosondes
Radiosondes on weather balloons provide information on the vertical profile of meteorological variables. For further details, see Balloon soundings.
Precipitation measurement
The X-band precipitation radar Meteor50DX is mounted to a trailer and can hence easily deployed to different locations. For volumetric precipitation measurement within a radius of 100 kilometres, it sends pulsed and focused radio waves (more precisely: microwaves) to a specific spatial direction. Radio wave pulses are scattered by various objects in the atmosphere such as hydrometeors (rain, snow, sleet, hail) contained in the volume. The backscattered component is received by the radar antenna and converted into a digital signal. From the characteristics of the received signal (radar echoes), the position of scattering bodies and their backscattering characteristics can be derived. The X-band radar is also capable of measuring the Doppler velocity of atmospheric scattering bodies as well as evaluating two polarization directions of the microwaves (horizontal and vertical).
Compromises on equipment must me made to keep the trailor below heavy transport. For example, the radar operates in the X-band, i.e. at a wavelength of 3 centimetres. The antenna diameter is limited (via the radome) by the maximum vehicle width. The increased attenuation of the radiation compared to C-band radars (like those of the radar network of the DWD), especially in precipitation, is another limitation that has to be accepted.
To compensate for this, the radar can be used very flexibly in places that cannot or only poorly be covered by operational equipment. In addition to reflectivity, the radar provides the radial velocity component as well as polarimetric quantities such as differential reflectivity, (specific) differential phase and the correlation coefficient between horizontal and vertical polarization, which allow conclusions about the type of hydrometeors.
Cloud determination
- Cloud radar: The scanning frequency modulated continuous wave (FMCW) cloud radar of KITcube allows high-resolution measurements of fog and clouds. Other than the X-band radar, which sends pulsed signals, a FMCW radar sends a continuous signal. Via the Doppler effect, wind speed components can be measured with the KITcube cloud radar.
- Cloud camera: For documentation of the cloud image and other optical phenomena over time, the KITcube contains two cloud camera systems, each equipped with two image sensors and lenses. Each camera system takes pictures with an aperture angle of 90° in horizontal direction (Landcam) and with an aperture angle of 180° into the zenith (Skycam). The Skycam captures the entire upper half-space and gives an overview of the entire cloud picture in the sky.
- Ceilometer: The Ceilometer determines cloud lower edges and penetration depths from the uncalibrated signal of a vertically aligned laser (frequency range close to the visible range) with a temporal resolution of one minute from up to three cloud layers.
Wind measurements
Lidar is one of the most advanced techniques for active remote sensing of the atmosphere. Lidar, an acronym for Light Detection And Ranging, is to some extend similar to the better known radar method. In contrast the radio waves used for radar, the lidar uses electromagnetic waves with much shorter wavelengths which are emitted and reflected by molecules or aerosol particles in the atmosphere. From the backscatter signal, information can be derived about the aerosol backscatter ratio, the extinction (absorption + scattering), the depolarization ratio (and thus the shape of the scatterer), as well as wind, the concentration of water vapor and other trace gases up to the temperature of the air. Exact capacities depend on the specific realization of the lidar system.
The lidar network at Swabian MOSES consists of several ground-based Doppler lidar systems specifically designed for wind measurements. The measurement technique is based on the Doppler effect, which describes the frequency shift of scattered light at moving objects. Depending on the scanning techniques used, vertical profiles of the horizontal or vertical wind can be measured and turbulence quantities can be determined. Based on the signal-to-noise ratio, a high-resolution determination of the boundary layer height is additionally possible, which also allows the visualization of small-scale mixing processes at the upper edge of the boundary layer.
Temperature and moisture determination
Scanning passive microwave radiometers (HATPRO, Humidity and Temperature Profiler) measure the radiation temperature in different wavelengths. From this, vertical temperature and humidity profiles are derived, as well as the vertically integrated liquid water content and the vertically integrated water vapor content, i.e. the amount of liquid water and water vapor in the air column above the radiometer. In addition, the temperature of the cloud base (if available) is derived from measurements with an infrared radiometer.
Aerosol measurement (photometer)
The photometer is part of the worldwide measurement network AERONET. It features electric motors for its orientation in azimuth and zenith angle and tracks the sun or the moon depending on the mode. From radiation measurements of these light sources, the so-called aerosol optical thickness is derived for certain wavelengths. In addition, information about the aerosol microphysical properties such as shape or material can be obtained via polarization filters.
Aerosol measuring systems
Aerosol measuring systems
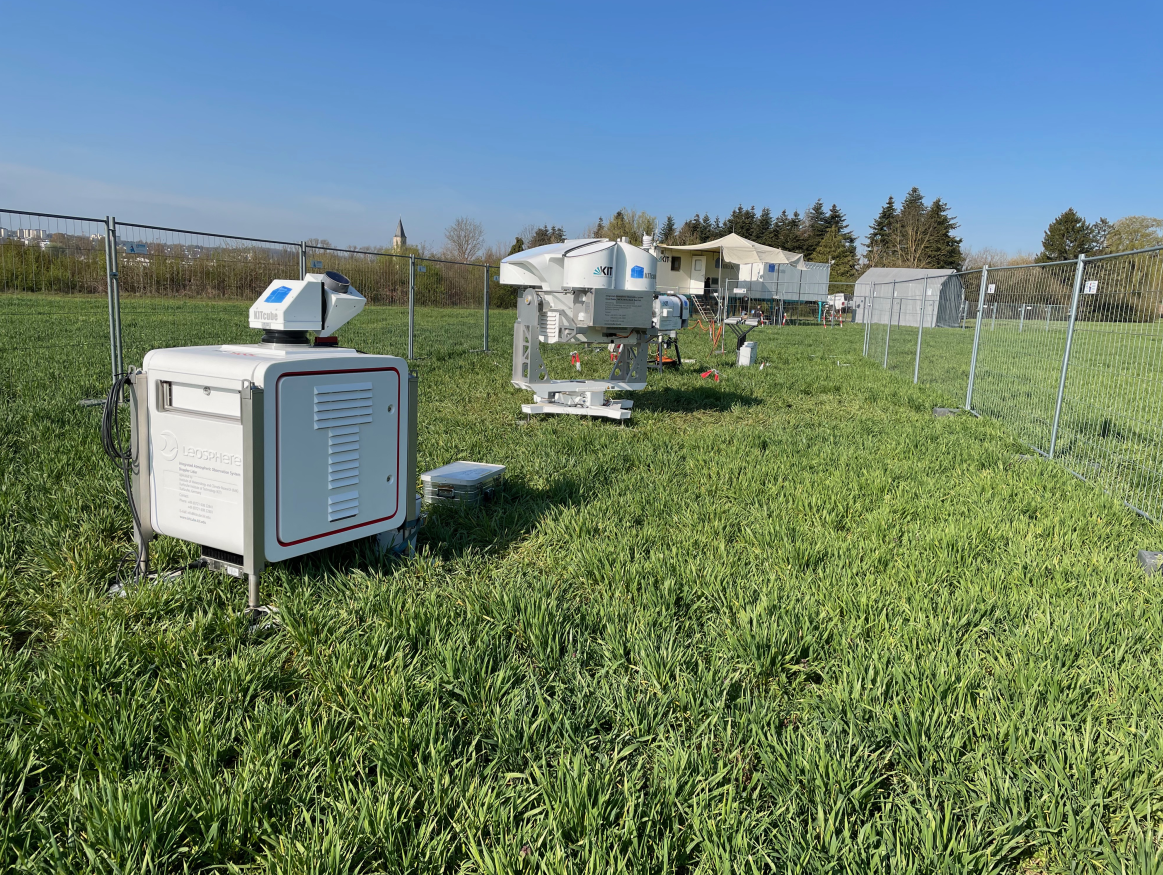
Aerosol Lidar
With an aerosol lidar (Light Detecting and Ranging) the spatial distribution of aerosol particles and droplets in the atmosphere can be measured contactless. This is achieved by tracking the backscattered radiation of a laser over distances of several kilometres, using a telescope-like device.
During the Swabian MOSES measurement campaign, a slewable Raman lidar is used, which can measure aerosol particles and cloud base over distances of 6-15 kilometres. The device emits an invisible laser beam (wavelength: 355 nm) whose photons are scattered by aerosol particles and cloud droplets. A 20-centimeter telescope is used to receive the backscatter signal. The laser beam and telescope can be swivelled to determine the spatial distribution of aerosol particles. Polarization of the backscattered laser light provides information about the shape of the particles.
Compared to ground-based measurements (see below), the information obtained with lidar measurements shows the vertical structure of particle distributions, the transport direction of aerosol clouds, cloud base and the extent of the well-mixed atmospheric layer above ground.
In situ aerosol meters
Condensation particle counters (CPC) can be used to reliably determine the number of aerosol particles larger than three nanometers (billionths of a meter) at a specific site (in situ). Aerosol particles are placed in a container saturated with alcohol or water, by condensation the particles increase in diameter such that they can be detected via light scattering.
Two methods are used to determine the size of the aerosol particles (see photo):
- With a scanning mobility particle sizer (SMPS) aerosol particles can be selected according to their electrical mobility. Subsequently the particles are counted by a condensation particle counter (CPC). This works for particles in the size range of approx. 8-1200 nanometers.
- An optical particle counter (OPC) measures the light scattered from individual aerosol particles. Using scattered light pulses, the size distribution of the particles can be calculated. This works for particles in the size range of approx. 300 nanometres to 40 micrometres (millionths of a metre).
Mobile cloud chamber PINE
PINE (Portable Ice Nucleation Experiment) is a mobile cloud chamber for the investigation of ice nucleating particles (INPs), which are relevant for ice crystal formation in mixed phase clouds (temperature range -10°C to -35°C, water saturated conditions) and cirrus clouds (temperature range -35°C to -60°C, water saturated conditions). An optical particle counter (fidas-pine, Palas GmbH, Karlsruhe) installed downstream in the chamber can detenct the forming ice crystals (the INPs) due to their larger diameter compared to cloud droplets and non-activated aerosol particles. This allows the determination of a temperature-dependent INP concentration. Further information.
Authors: Dr. Harald Saathoff, Dr. Ottmar Möhler, IMK-AAF
Balloon soundings
Balloon soundings
.gif)
Balloon soundings in the atmosphere
The higher atmospheric layers can be measured preferably with helium-filled weather balloons. Various measuring instruments are attached to these balloons, which then measure various parameters as the balloon rises (and also as it sinks later). Depending on their size, the balloons rise to an altitude of 20 to 35 kilometers and thus fly much higher than airplanes. After the balloon bursts, the descent begins, during which a parachute is usually used to slow the descent. On the one hand, this prevents damage, and on the other hand, it allows measurements to be made under controlled conditions even during descent.
In the simplest case, a so-called radiosonde is attached to a weather balloon. This device measures temperature, humidity, air pressure and position information (GPS) and sends the information by radio to the ground station. In addition, it is possible to hang other instruments on the weather balloon besides the radiosonde. These are then, for example, an ozone instrument, with which the ozone layer, particularly in the stratosphere can be measured, or a precise hygrometer, with which the low water vapor concentration at the transition from the troposphere to the stratosphere (tropopause) at an altitude of about 12 kilometers can be precisely determined. Depending on the situation, a particle measuring instrument is also used to precisely locate cloud droplets, ice crystals or dust particles in the atmosphere.
As part of the Swabian MOSES 2023 measurement campaign, balloon soundings will be carried out at two locations: at the main site in Villingen-Schwenningen and in Alsace, France. In Villingen-Schwenningen, the weather balloons are filled manually and allowed to rise; in Alsace, there is an autolauncher. This autolauncher (Vaisala Autosonde AS41) performs balloon soundings fully automatically controlled remotely.
Stream surveys
Stream surveys
Measuring probes
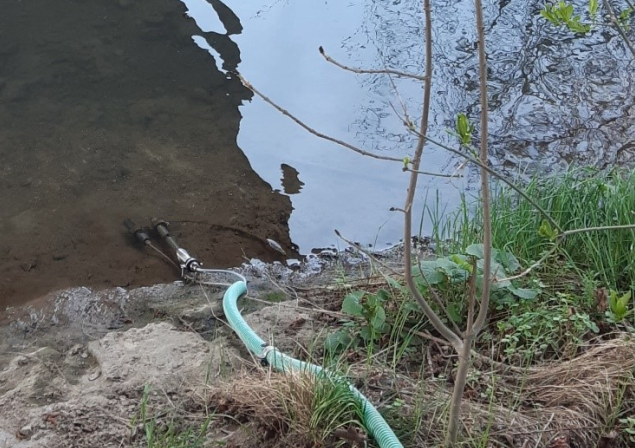
During flood events, hydrological and water chemical parameters change within a very short time. In order to record these dynamics, nine continuously measuring probes are installed at three locations in the rivers Ammer, Steinlach and Goldersbach. For example, the CTD turbidity probe (see photo) measures electrical conductivity, water temperature, water level and turbidity. Other probes measure the parameters oxygen, pH and chlorophyll. A third probe developed by the UFZ outputs information on dissolved organic carbon and nitrate levels.
ISCO Autosampler
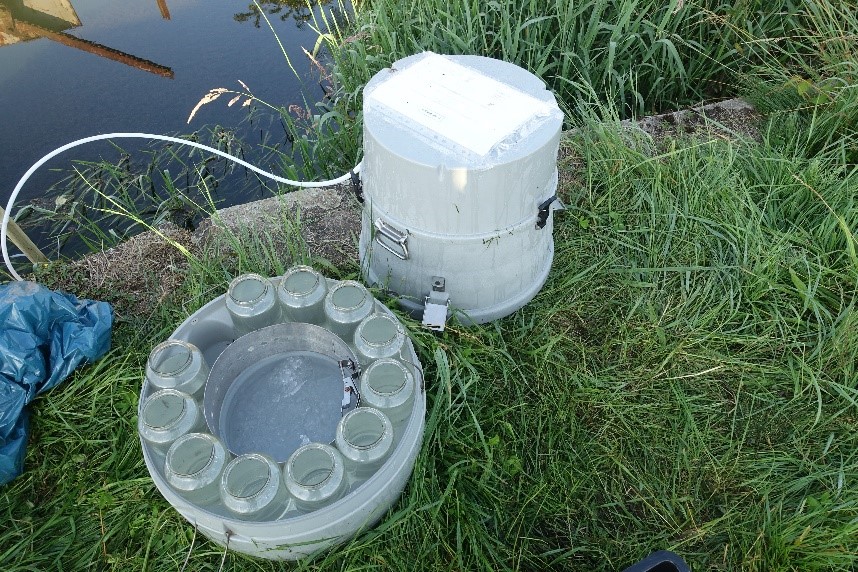
For all water quality parameters that cannot be measured with probes, automatic samplers, so-called autosamplers from ISCO (Model 3700; see photo), are used. An integrated pump draws water samples at predefined time intervals and fills glass bottles located inside the device. Autosamplers generate composite water samples, by e.g. pumping a volume of 250 milliliters into the same 1-liter bottle four times per hour (every 15 minutes), that reflect changes in water chemistry over time. Since river water is usually very turbid during floods, suspended solids are also sampled. In addition to automatically generated composite water samples, manual sampling will be conducted at some sites, primarily to decipher pollutant inputs from specific sources such as urban areas or road runoff, and to investigate the extent to which rivers are sources of greenhouse gases in relation to the degree of land use in the catchment (see research objectives).
Chemical and bioanalytical methods
Samples collected during rain events will be processed in the laboratory of the Geo- and Environmental Research Centre of the University of Tübingen. Using instrumental analysis, complex chemical mixtures in the water will then be identified and their toxic effects determined using bioanalytical methods. In this process, pollutants dissolved in water and chemicals bound to particles are separated from each other by filtration and examined separately. Analyses at the University of Tübingen include nutrients such as nitrate, particle size distribution and the determination of dissolved carbon.
At the UFZ Department of Cell Toxicology in Leipzig, the high-throughput platform CITEPro (Chemicals in the Environment Profiler) is used to analyse the effects of chemical mixtures, using cell-based in vitro bioassays. In addition, organic chemicals are identified and their concentrations determined using high-resolution mass spectrometry (HR-MS). At the UFZ in Magdeburg, trace elements such as zinc, copper, iron and gadolinium are analysed, which can be used as indicators for certain substance input pathways, e.g. from urban areas. In addition, at the UFZ Leipzig, ultra-high resolution mass spectrometry (FT-ICR-MS) is used to characterise dissolved organic material from various sources in the catchment area in more detail. At the KIT branch in Garmisch-Partenkirchen, analyses of greenhouse gases such as nitrous oxide are performed.
Authors: Dr. Clarissa Glaser, University of Tübingen; Dr. Stephanie Spahr, University of Tübingen/IGB Berlin & Dr. PD Ralf Kiese, KIT
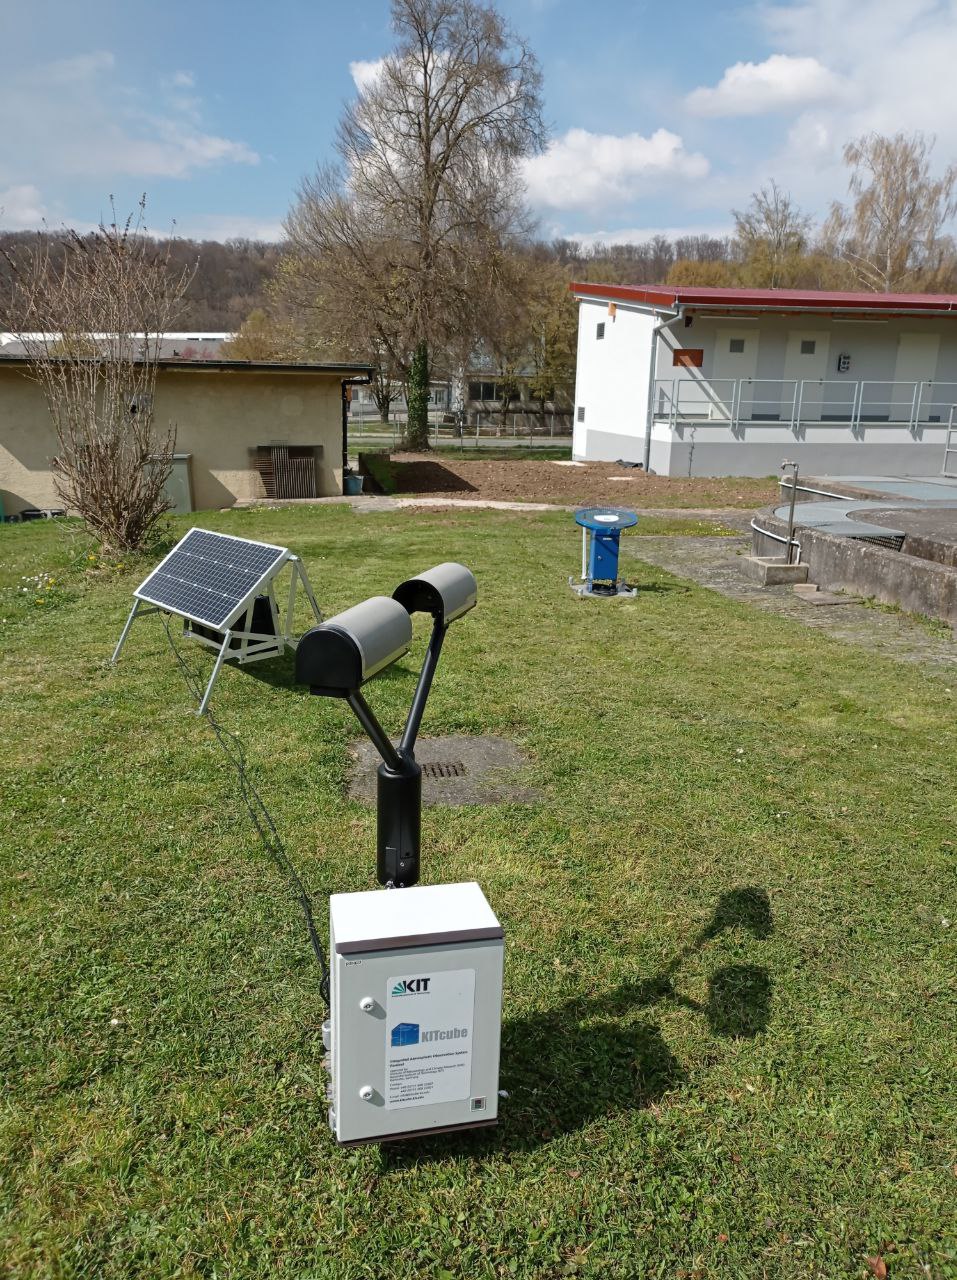
Infrasound sensor
Measurements with the infrasound sensor
Fluctuations of the atmospheric ground pressure are an expression of the weather pattern and are also recorded by many amateur meteorologists. In addition to the slow fluctuations recorded by a barometer, thunderstorm cells, for example, can also generate sudden pressure fluctuations. These pressure fluctuations are sources of infrasound waves that can propagate in the atmosphere over long distances. The infrasound range adjoins the audible range at lower frequencies; the transition between the infrasound range and the acoustic sound range is about 20 hertz (audible range spans about 20 to 20,000 hertz, depending on age and volume).
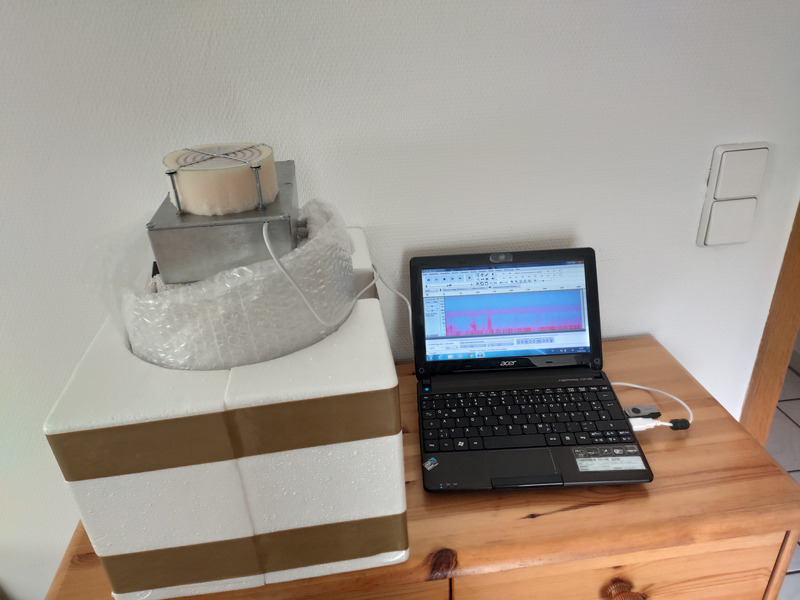
The operated campaign sensor detects pressure fluctuations in the frequency range from about 0.02 to 100 Hertz, and can therefore detect infrasonic waves and acoustic waves in the lower audible range. A sensitive differential pressure sensor is used for detection (Sensirion SPD816-125Pa), which detects the pressure difference between a sealed reference vessel (a glass vessel with a volume of 5 liters) and the environment. To detect the pressure difference, the sensor allows a small flow of air driven by the pressure difference between the reference volume and the outside air through a narrow channel. A heat source is located in the duct, and the air temperature is measured on both sides of the source. The flow velocity can be derived from the temperature difference and from this, finally, the sought pressure difference.
The figure on the right shows the sensor: the reference vessel is wrapped in thermal insulation to prevent rapid temperature fluctuations of the reference - which would also simulate pressure fluctuations. The actual sensor element is located in the metal housing above the reference vessel. The data is automatically recorded with the help of a notebook and transferred to the campaign's data server via an LTE connection.
Only a few measurements have been performed so far to investigate the infrasound signals of convective events. In the Swabian MOSES campaign, infrasound measurements will be combined with the long-range diagnostics of the KITcube instruments to gain additional information on the flow events in a thunderstorm cell.
Author: Dr. Frank Hase, IMK-ASF
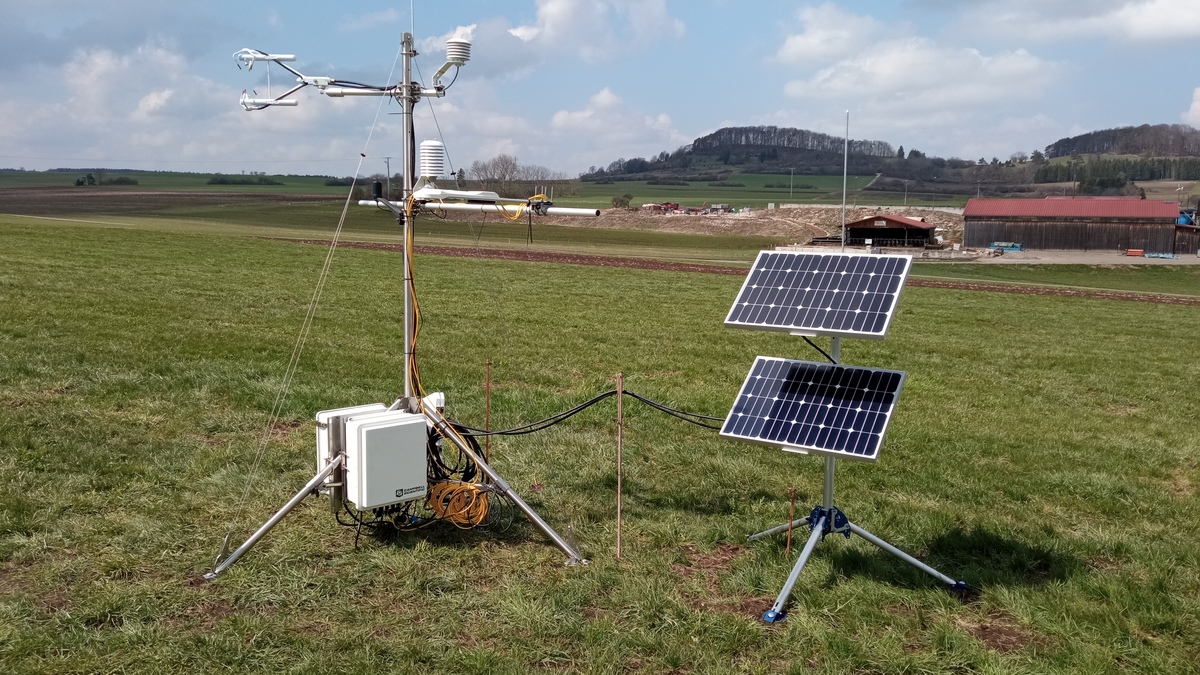
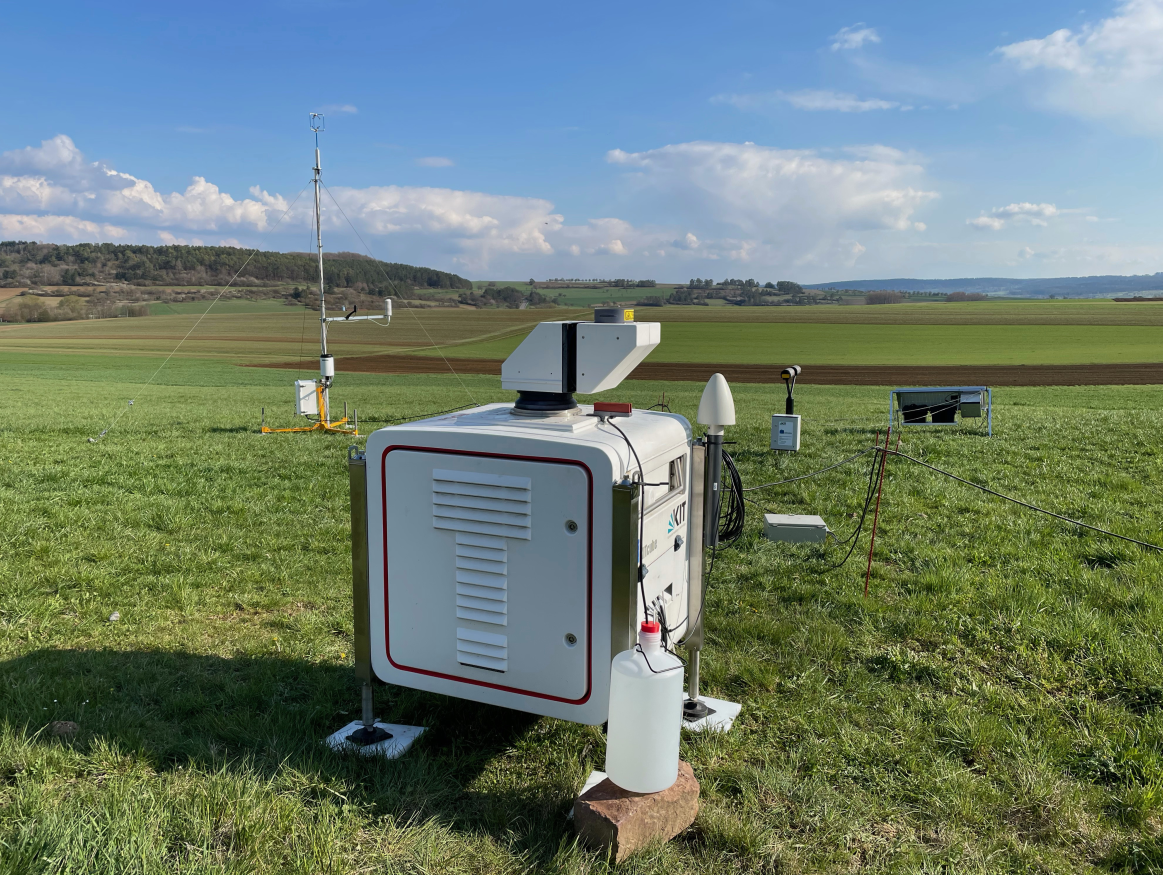
MoLEAF Tower
MoLEAF Tower
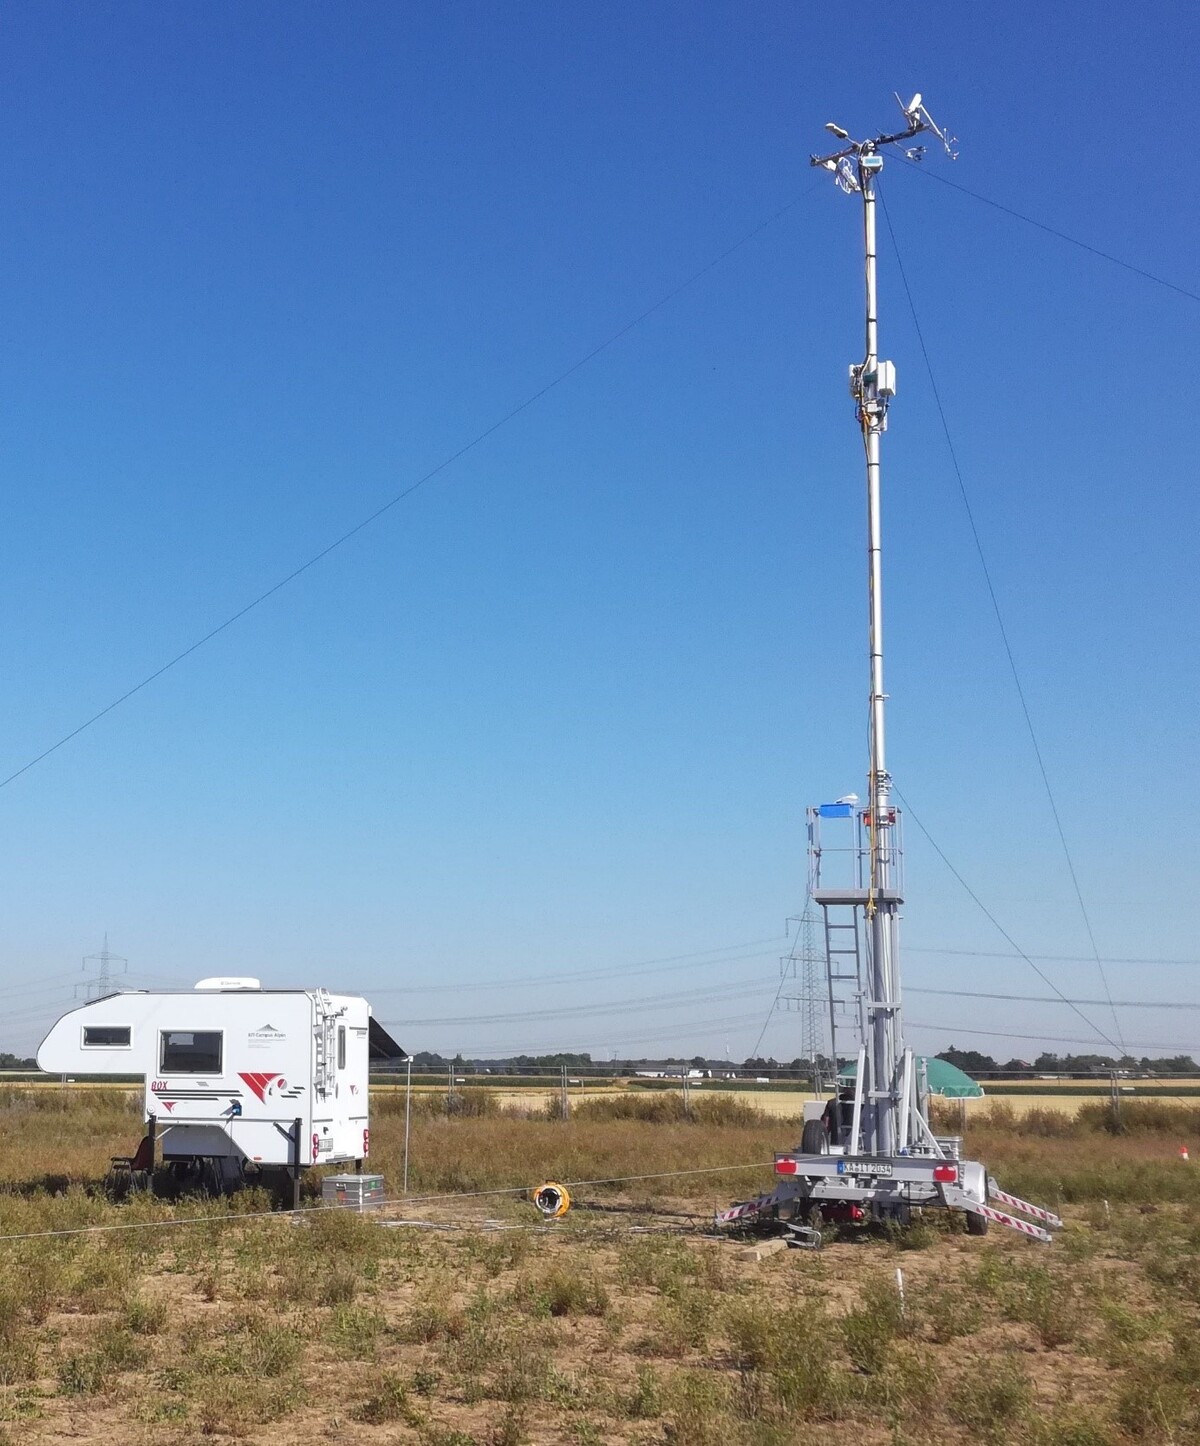
MoLEAF (Mobile Land-Ecosystem-Atmosphere Flux) is a mobile measuring system that is used to measure the fluxes of energy and matter between the land surface and the atmosphere. This system consists of a trailer mast, which is equipped with various measuring instruments and can be pneumatically extended to a height of 30 metres. The second important component of the MoLEAF system is a mobile laboratory cabin that can be transported on a pickup truck and can dropped at the measurement site. It contains a computer workstation, the power supply for the measurement system, and the internet connection. Together this enables the rapid deployment of the measuring system in the event of extreme weather events with a short warning time and self-sufficient operation on site. Thus, measurements can start within a few hours after arrival at the site.
The central measuring unit of the MoLEAF is a so-called eddy covariance system, which is based on a common and widely used method for measuring and calculating vertical turbulent fluxes within atmospheric boundary layers. The eddy covariance method analyzes high-frequency wind and scalar atmospheric data series, gases, energy, and momentum to determine the vertical fluxes of these quantities. This statistical method in commonly used in meteorology and other applications (micrometeorology, oceanography, hydrology, agricultural sciences, industrial and regulatory applications, etc.) to determine the exchange fluxes of trace gases over natural ecosystems and agricultural fields and to quantify gas emission rates. The method is also widely used to verify and calibrate climate and weather models, complex biogeochemical and ecological models, and remote sensing estimates from satellites and aircraft. Due to its mathematic complexity the covariance method requires considerable care in setting up and processing data.
Via the eddy covariance system the exchange of sensible heat, i.e. the energy used to heat the air, the exchange of CO2, and evaporation can be determined. In addition, the MoLEAF has measuring instruments for recording the radiation balance, which is composed of short-wave and long-wave radiation, for determining the soil heat flux, the soil water content, the air temperature and the air humidity. Wind speed and direction are also recorded. All measurements are continuously and automatically operated during measrement campaing, with a high temporal resolution (0.1 seconds for turbulent quantities and 1 minute for non-turbulent quantities) and can also be monitored remotely via the Internet.
Author: Dr. Matthias Mauder, IMK-IFU
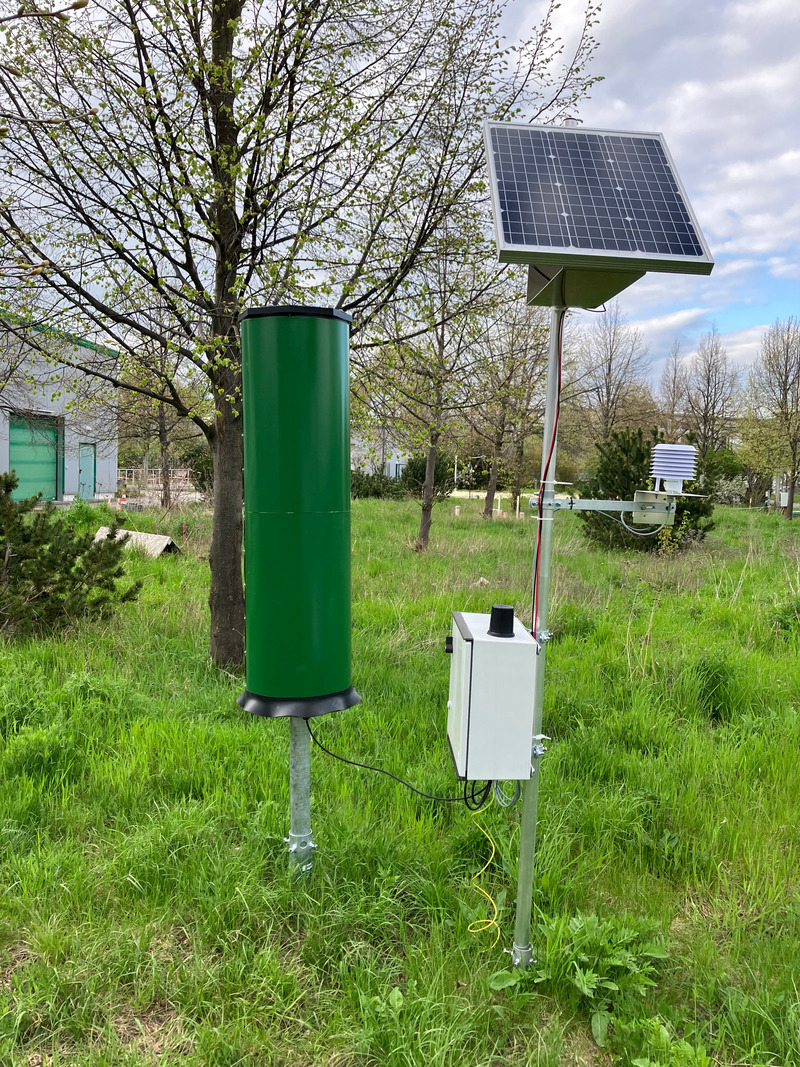
Soil Moisture Sensor Network
Soil Moisture Sensor Network
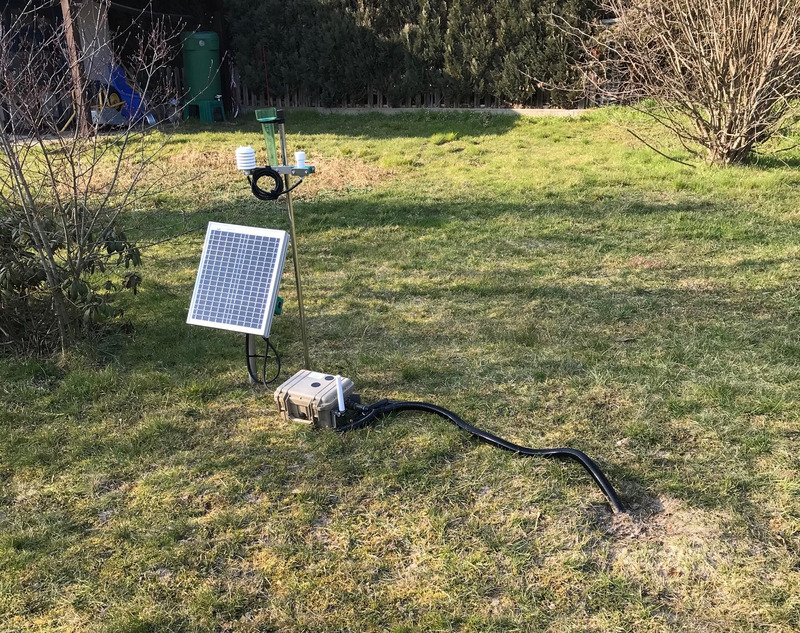
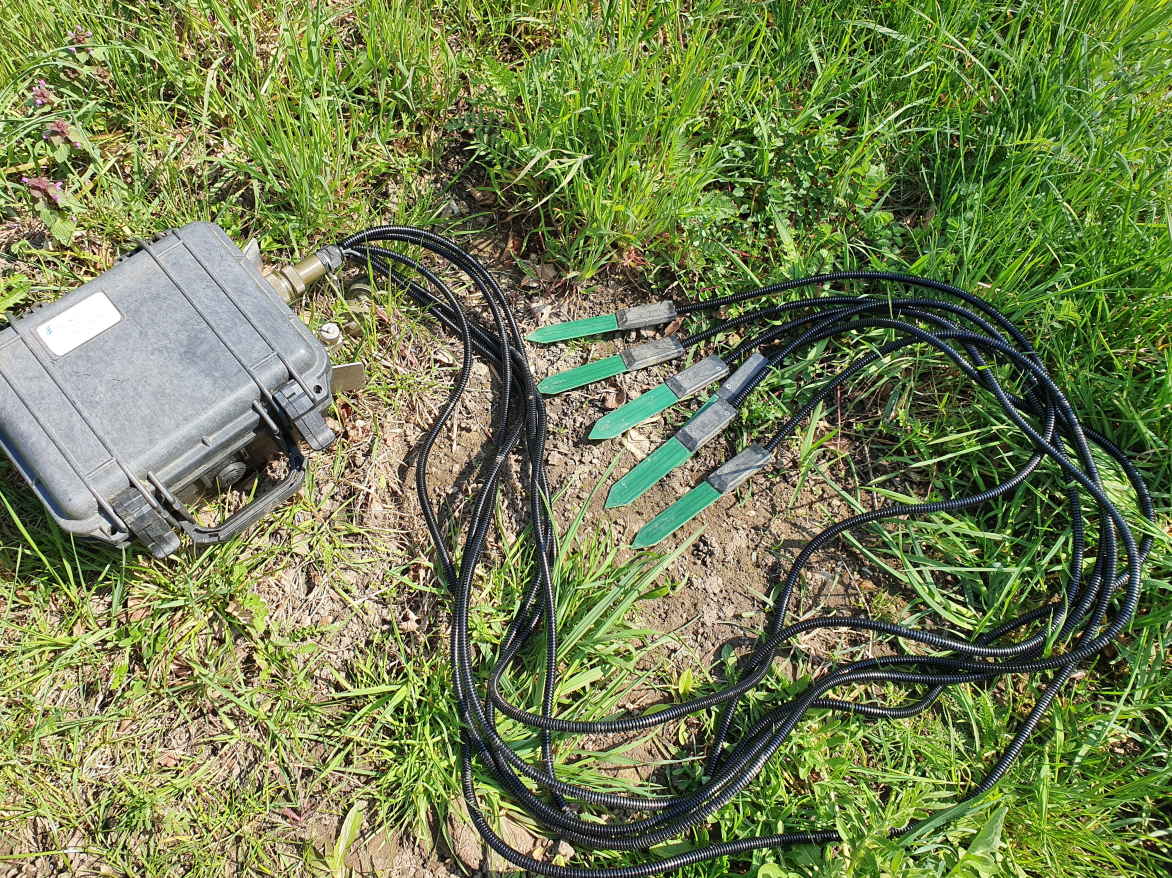
A network of soil moisture sensors enables the continuous determination of soil moisture and soil temperature at different depths. The mobile devices used in the campaign consist of individual sensor nodes, to each of which six soil moisture sensors are connected. The sensors are installed in pairs, so the soil moisture and soil temperature can be determined at each location at three different depths. The measured data is transferred to a database via mobile radio and visualized.
The soil moisture sensors work according to the TDT principle (Time Domain Transmission). The principle is based on the influence of the dielectric properties of the soil on the propagation speed of an electromagnetic signal that is transmitted as a pulse to the sensors. Water is characterized by high dielectricity compared to dry soil. A high water content in the soil and thus a high dielectricity slows down the propagation speed of the electromagnetic signal. With the inclusion of other parameters such as soil temperature, the soil moisture can be determined from the propagation velocity.
Why are these measurements important? Soil moisture is an important state variable of natural soils, which is not only of great importance for agriculture (see research objectives). Due to the pronounced heterogeneity and complexity of soils, soil moisture is also characterized by high temporal and spatial variability. Single measurements often cannot adequately represent such changes due to their principle. Wireless sensor networks make it possible to investigate the temporal and spatial dynamics of soil moisture.
More infomation about the activity within Swabian MOSES as well as live data can be found here
Authors: Matteo Bauckholt, Prof. Dr. Peter Dietrich, UFZ
Distrometer network (Precipitation measurement)
Distrometer network
Precipitation measurements with radars such as the KITcube X-band radar provide very high spatial and temporal resolution information that cannot be achieved with a ground network of precipitation gauges. However, they also suffer from typical measurement errors. These are attempted to be minimized by taking advantage of the (relatively few) measurements on the ground to enrich the radar measurement.
For Swabian MOSES, a network of 23 optical distrometers (parsivels) is being set up for the first time. While conventional rain gauges only provide information on the amount of precipitation that has fallen, the use of distrometers also provides information on the composition of the precipitation according to size and precipitation type. Exactly this information can also be estimated from the measurements of the polarimetric KITcube X-band radar. By comparison with the distrometers distributed throughout the measurement area, the radar-based information can be verified and improved by calibration (also of the polarimetric measured quantities).
Author: Dr. Jan Handwerker, IMK-TRO
Hail Sensor Network
Hail Sensor Network
Despite the massive damage caused by severe hail events, especially in the Swabian MOSES study area, hail is not measured directly at the many weather stations in Germany. However, the size distributions of the hailstones, the so-called spectra, are relevant for several applications. Precipitation radars, for example, also measure hail in principle, but they only provide a total signal (or several signals in the case of modern dual-pole instruments) in the atmosphere at an altitude of about 1 kilometer.
Observed spectra can be used to improve conversion methods of the radar signal to hail on the ground. The hail spectra are also critical for damage to buildings, vehicles, and agricultural crops. Therefore, they are needed for the most accurate calculation of hail damage and hail risk. Finally, long-term measurements of the hailstones can be used to determine possible trends caused by climate change.
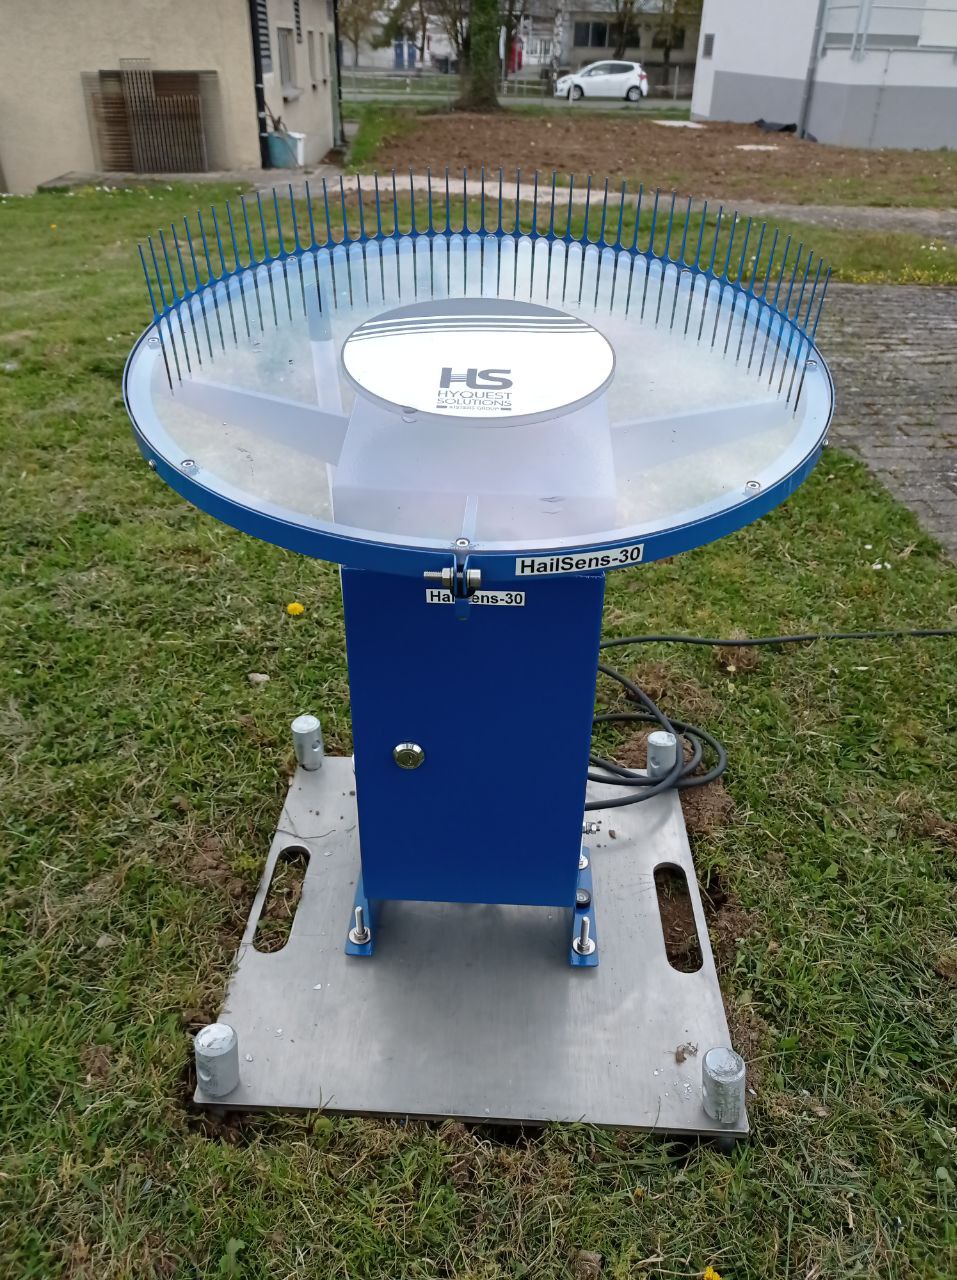
The newly developed measuring device HailSens is capable of measuring hail spectra with high temporal resolution. When a hailstone strikes the receiving surface, the surface is set into vibration, which is then detected by a piezoelectric microphone mounted below the receiving surface. From this, it can then be determined how many hailstones hit and how large they are. Each impact of a hailstone is registered and automatically sent to a server. There, the data is then available in almost real time.
As part of the Swabian MOSES field measurement campaign, a total of 10 hail measuring devices have been installed - precisely at the locations where, according to the IMK 's radar analyses, hail occurs most frequently.
Author: Prof. Dr. Michael Kunz, IMK-TRO
Wind Lidar Network
Windlidar network
The measurement of wind as a vectorial quantity (wind speed and direction) with strong spatial and temporal variability poses great challenges to the measurement concept and measurement technology, but is of fundamental importance for understanding the energy and material balance of the atmosphere.
Doppler lidar instruments determine the velocity of scatterers (aerosol particles) moving with the wind based on the Doppler effect along a laser beam up to distances of 10 kilometers. To determine the wind vector as well as vertical and horizontal sections, the laser beam is directed in different directions into the half-space above the instrument via a controllable mirror system (scanner). A special added value arises from the combined and synchronized use of the instruments, whereby either small-scale (e.g. in valleys) high-resolution flow patterns can be measured or, as in the case of the Swabian MOSES measurement campaign, larger-scale flow characteristics can be measured in more extensive study areas, which means that, for example, the advection and flow convergence important for thunderstorm formation can be determined (see research objectives).
Within the framework of Swabian MOSES, the IMK-TRO operates Doppler lidar devices with data transmission in near real time to determine the wind profile up to heights of 3 kilometers at a total of 7 sites in the study area between the eastern Black Forest, Neckar Valley and western Swabian Alb. These will be complemented by airborne scanning Doppler lidar in June and July (see research aircraft). Instruments of the project partners IMK-IFU and University of Hohenheim complement the network with two additional sites.
Author: Dr. Andreas Wieser, IMK-TRO
Rover - Cosmic Neutron Sensor
Rover - Cosmic Neutron Sensor
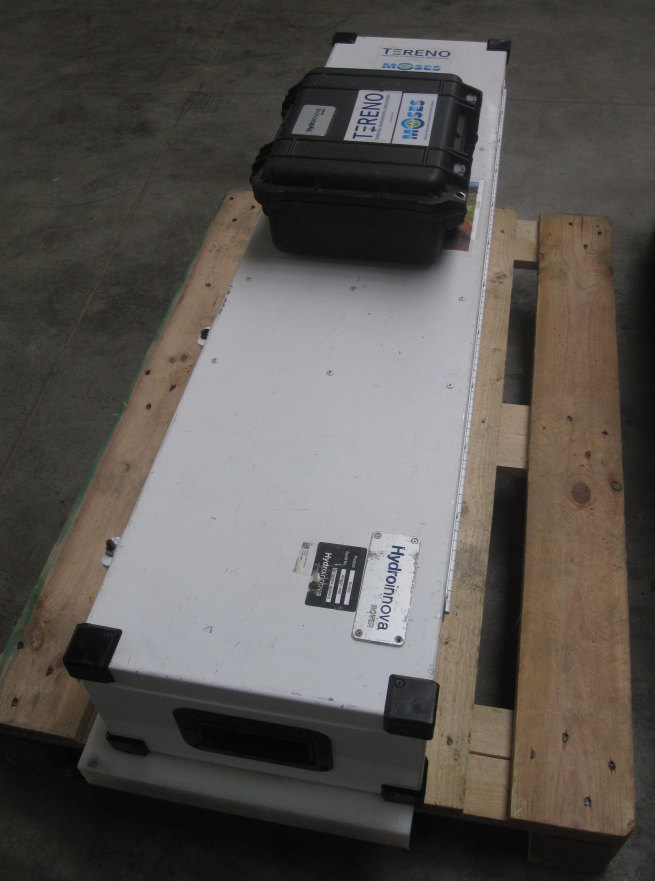
Cosmic-Ray Neutron Sensing (CRNS) is a mobile, non-contact technology for determining mean soil moisture in the vicinity of about 15 hectares. The method is based on the detection of neutrons "reflected" in the soil. Since these are particularly sensitive to hydrogen atoms, a direct dependence of neutron intensity on the prevailing water in the root zone around the sensor can be deduced. Since the neutrons are derived from cosmic events, such as stellar explosions, this measurement method is called Cosmic-Ray Neutron Sensing.
Inside the sensor are usually detector gases (e.g., helium) that react to neutrons passing through and generate a pulse of current. These pulses are counted and stored in the data logger along with information such as GPS coordinates, temperature, air pressure and humidity. The information collected can be used to estimate soil moisture from the signal.
The stationary sensors are already being used successfully in research and agriculture to measure hourly changes in soil moisture over several years. To obtain information about an entire field or a specific catchment area, the detector can be used in mobile mode, called roving. In this mode, the sensor is installed in a vehicle and simply counts neutrons while the vehicle is moving. Measurement data and coordinates are collected every 10 seconds so that an average soil moisture can be calculated for the distance traveled.
As part of the Swabian MOSES 2023 measurement campaign, a stationary cosmic-ray sensor will be installed at the main site in Villingen-Schwenningen. Thus, the mean soil moisture within a radius of about 200m around the sensor and the change over the entire measurement period can be determined.
In the catchment area of the Lindach river, event-related runs are carried out with a mobile Cosmic-Ray-Rover. Before and after heavy rain events, a fixed route is driven so that changes in soil moisture due to precipitation can be determined at the landscape scale. In order to validate the measurement results of the mobile sensor, the locations of the soil moisture networks in the Lindach catchment area are approached. At the respective stations, the vehicle is parked next to the soil moisture network for five to ten minutes, since the measurement uncertainty is lower the longer the rover stays at a location. This allows the results of both measurement methods to be compared at specific points.
A solid estimate of soil moisture at the landscape scale is relevant for hydrological modeling. This can be used to predict future weather developments, for example to estimate the risk from droughts, heat waves or floods (see research objectives).
Authors: Mandy Kasner, Prof. Dr. Peter Dietrich, UFZ
Additional information on Cosmic Ray Neutron Sensing & Roving and its use in other projects: Homepage
Hail Swarm Probes
Hail Swarm Probes
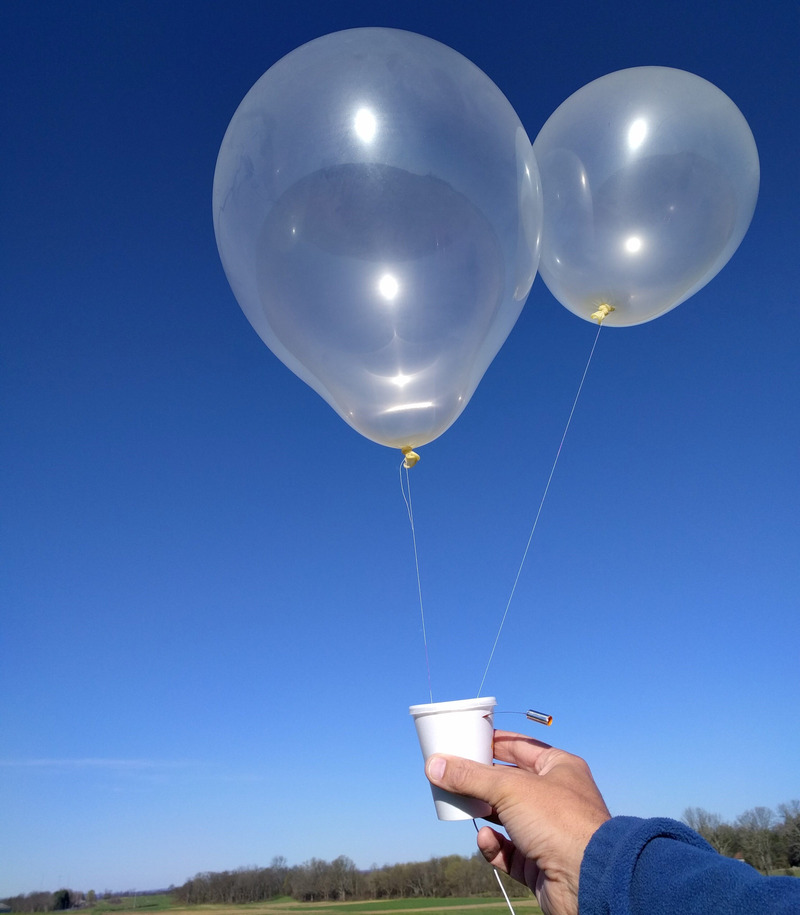
The vertical temperature and humidity profile of the atmosphere is crucial for the formation and intensity of thunderstorm events. In addition, the three-dimensional (3D) wind field, especially in the upwind region of a thundercloud, determines the strength of precipitation in the form of rain or hail (see research objectives).
Using the small (size of a yogurt cup) and lightweight (12 gram) swarm probes of Sparv vertical profiles of air temperature, humidity, pressure and the 3D wind field can be measured directly in a thundercloud during mobile deployment. They transmit the measured parameters every 4 seconds via radio to the mobile ground station. A real-time map continuously displays the position of all probes. The swarm probe is a new type of measuring instrument that provides several series of measurements in a defined air volume for up to one hour. Up to 17 balloon-borne probes can be launched simultaneously or in close proximity, for example directly in front of a thundercloud. The probes ascend to a user-defined altitude and then follow the flow in the thundercloud on so-called Lagrangian orbits.
The individual probes can be separated from the balloons in the further course either by remote command or from a further, previously defined height and thus fall to the ground. Due to their low weight, the fall velocity and thus the momentum when hitting the ground is low, so that the probes can be used several times (if they are recovered).
Author: Prof. Dr. Michael Kunz, IMK-TRO
Wingcopter Drone
Wingcopter drone
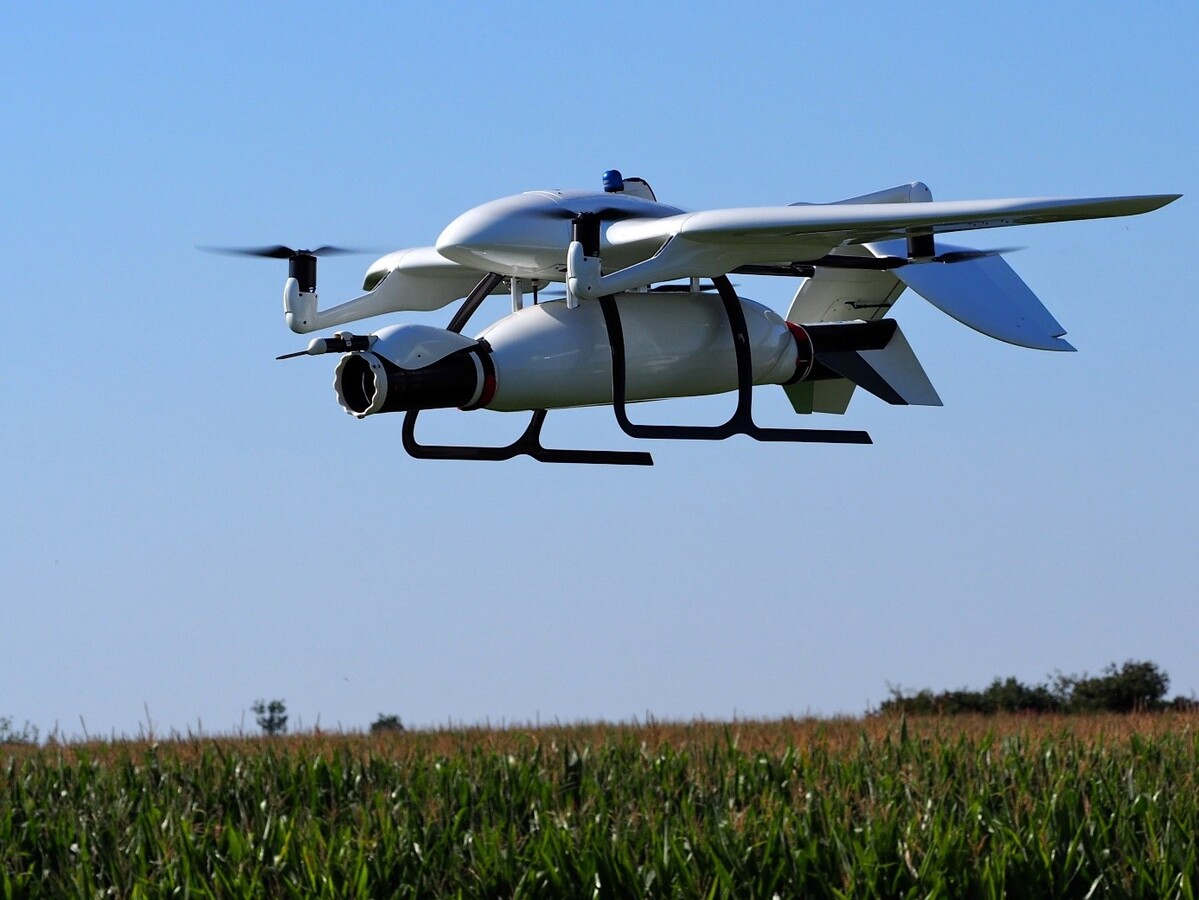
The Wingcopter Eddy Covariance Drone is a measuring system developed to determine the exchange of greenhouse gases between the atmosphere and ground-level sources or sinks (such as vegetation, soil organisms or mofettes).
For this purpose, it is equipped with a five-hole probe wind measuring instrument, a fine-wire thermometer that measures particularly quick and sensitive, and a combined carbon dioxide/water vapour sensor. In future is is planned to add a laser methane sensor.
The Eddy covariance method is the methodological and mathematical basis of the measuring system. In the presence of a vertical gradient of an atmospheric variable (such as a gas concentration), it describes the systematic relationship between the vertical movement of air parcels with which this variable is transported and its resulting change at a given measurement height.
This vertical motion is determined as a component of the three-dimensional wind field with the five-hole probe instrument. This instrument uses the differences of the dynamic pressures, which are applied directionally to the slightly inclined pressure holes of the probe, in order to measure the relative inflow of the drone flying horizontally at about 50 meters above the ground at a speed of about 80 km/h. At the same time, the exact flight attitude of the drone is determined. The atmospheric wind field in which the drone is moving is then determined by simultaneously recording its exact flight attitude and movement using inertial and satellite navigation. Rapid determination of gas concentrations in the air parcels moving with the wind field is achieved by measuring the concentration-dependent absorption of infrared radiation by these gases inside the measurement system.
Over areas that are particularly relevant to the climate system and worthy of consideration for climate research, the Wingcopter Eddy Covariance Drone can thus be used to quantify the vertical fluxes of humidity, heat and, in particular, of the greenhouse gases mentioned, and thus to study and balance them in greater detail (see research objectives).
Author: Prof. Dr. Torsten Sachs, GFZ
Research aircraft
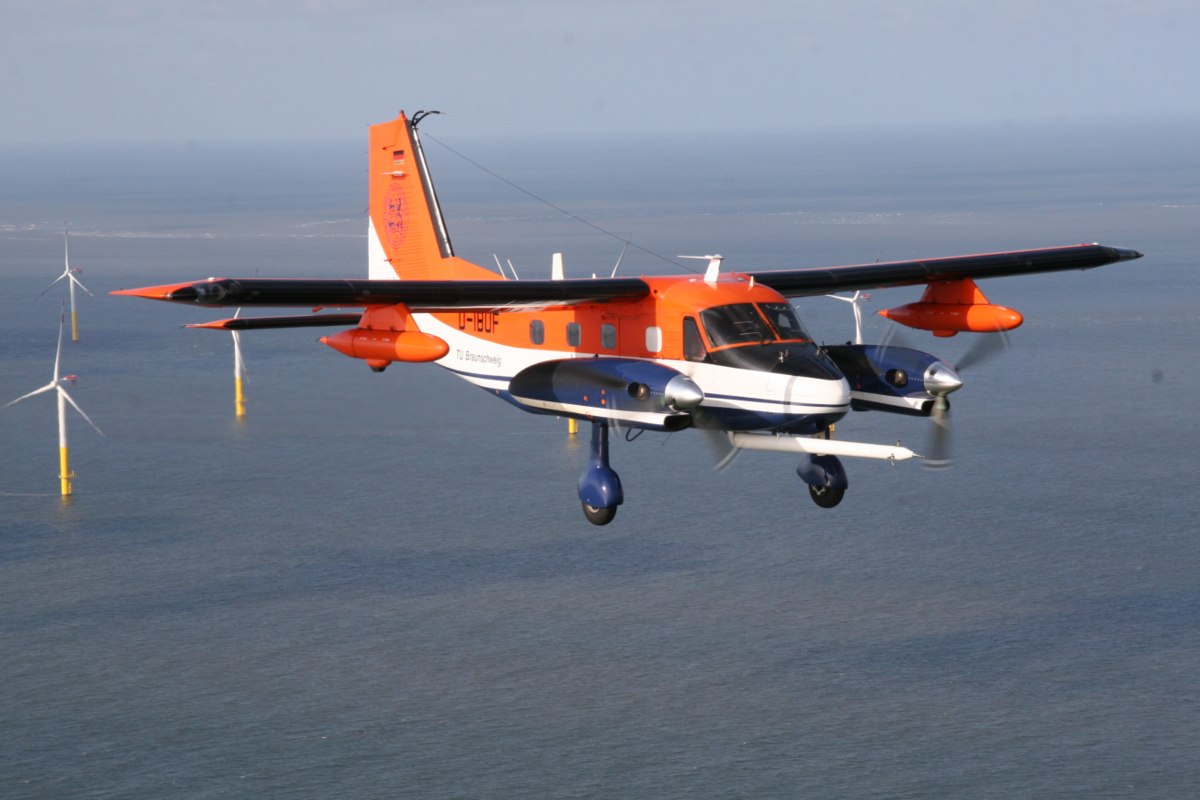
Dornier Do128-6 "D-IBUF"
The research aircraft "D-IBUF" is a twin-engine aircraft of the type Dornier Do128-6. It offers space for 2 pilots and 2 to 3 scientists and has been operated for more than 30 years by the Technical University (TU) Braunschweig as a research aircraft in numerous national and international measurement campaigns. The standard equipment includes devices for measuring the following meteorological parameters:
- Wind (direction and speed)
- Turbulence
- Air temperature and humidity
- Incoming and reflected radiation
- Earth surface temperature
The main parameters are measured at the tip of a nose boom in the undisturbed flow in front of the aircraft. In addition, navigation and aircraft parameters (e.g. position, altitude, airspeed, position of the aircraft in space) are recorded. The normal measuring airspeed of Swabian MOSES is about 100 knots (approximately 180 km/h).
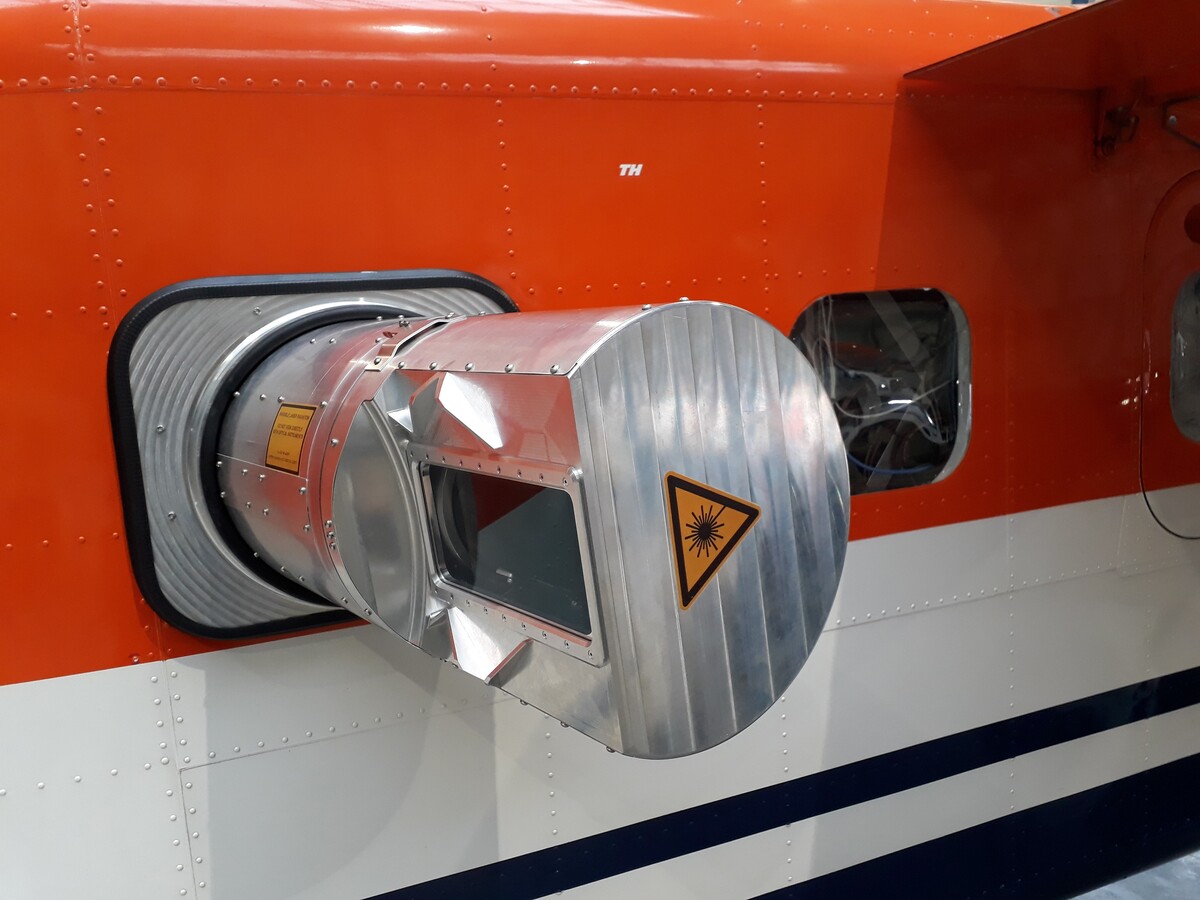
A further measuring system installed on the "D-IBUF" for this measuring campaign is a wind lidar of the type Windtracer is (see photo, more information). The wind lidar can measure the wind below the aircraft at all heights simultaneously. For measurement, the wind lidar sends laser pulses of known frequency (corresponding to a precisely known colour) into the atmosphere. Part of the laser signal is backscattered by dust, pollen and other particles moving with the wind. If the particles move in the direction of the beam, the frequency of the backscattered light will be slightly different from the emitted signal (corresponding to a very small color difference). This frequency difference is measured by the lidar, which can be used to determine the wind speed.
Since only the wind speed in beam direction is measured, the lidar sees the vertical wind (up and down winds) when looking straight down. For measuring the horizontal wind, the laser beam is tilted by a scanner and moved in a circle (see photo and research objectives). The wind speed then varies depending on the scan direction, from which the horizontal wind can be derived.
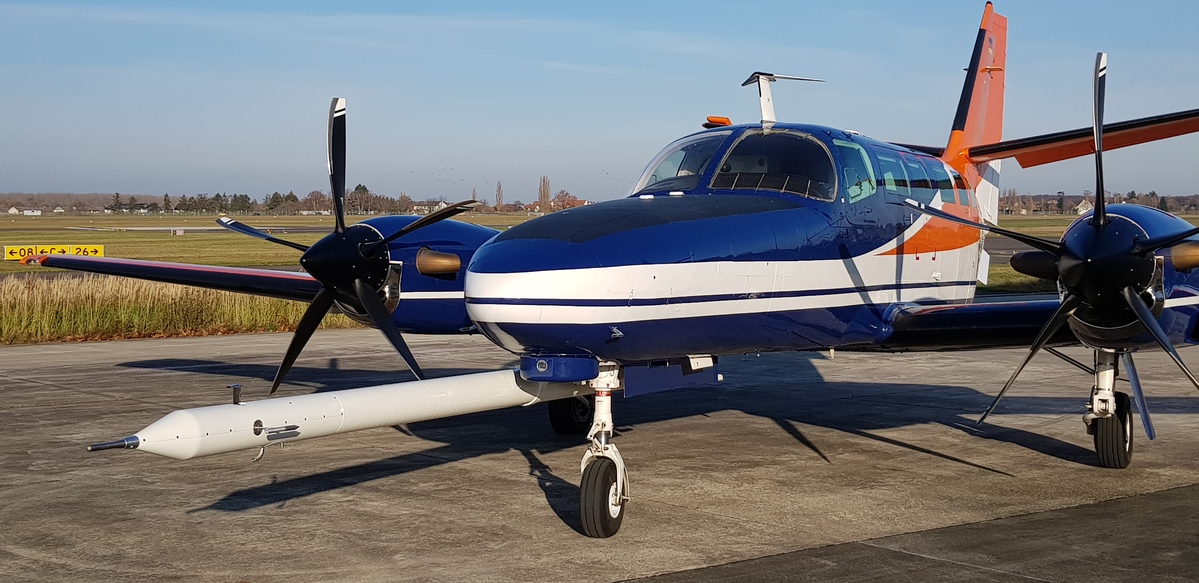
Cessna F406 "D-ILAB"
The research aircraft "D-ILAB" of the TU Braunschweig is a twin-engine aircraft of the type Cessna F406. It offers space for 2 pilots and 2 to 3 scientists and is equipped with measurement sensors to determine the same meteorological parameters as the "D-IBUF".
The essential parameters are measured at the tip of a nose boom in the undisturbed flow in front of the aircraft. In addition navigation and aircraft parameters are recorded. The normal airspeed during the measurements is much higher compared to the "D-IBUF" of about 140 knots (about 250km/h). The aircraft can be used flexibly (under consideration of the legal airspace restrictions) and will provide the connection between the different stationary measurement sites.
The research aircraft "D-ILAB" was purchased by the TU Braunschweig in 2020 and will be used for research flights for the first time in 2021. In the future it will replace the "D-IBUF" which has been in operation for more than 30 years.
Authors: Dr.-Ing. Thomas Feuerle, TU Braunschweig & Philipp Gasch, IMK-TRO
More information about the Institute of Flight Guidance at TU Braunschweig: Homepage